Figures & data
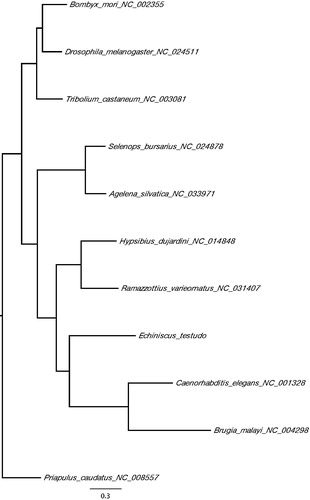
Figure 1. A maximum-likelihood tree of the phylogenetic position of E. testudo among other ecdysozoan species. The tree was calculated from concatenated amino acid sequences of 13 mitochondrial protein genes using multiple alignment with MAFFT (Katoh and Standley Citation2014), followed by Trimal (80% consensus) and Fasttree (Price et al. Citation2009). Tree is visualized with FigTree (http://tree.bio.ed.ac.uk/software/figtree/). Priapulus caudatus was used as an outgroup. GenBank accession numbers of mitogenome sequences used is shown after the species names.