Figures & data
Figure 1. Characteristics and phylogenetic analysis of mitogenome in five high-altitude species and their low-altitude relatives. (a) Detailed information of animals and geographical locations. b. Base content of mitochondrial genome across five species. c. Neighbor joining tree of five species, based on complete mtDNA sequences (Accession numbers: MG837547-MG837556); red branches denote high-altitude animals, and blue branches denote low-altitude animals.
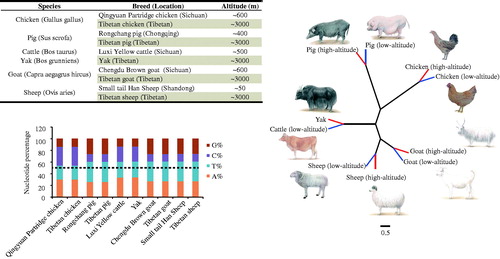
Table 1. Genetic diversity analysis of the mtDNA D-loop region between high-altitude (from Tibet) and low-altitude animals (mostly from Sichuan basin).
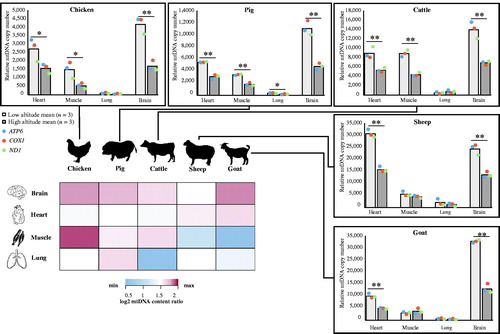
Figure 2. mtDNA copy number analysis of four tissues across five species, and a heatmap of mtDNA copy number ratio between low- and high-altitude animals (n = 3/group) in those four tissues. Student’s t-test, *p < 0.05, **p < 0.01. Colored entries represent the log2 mtDNA copy number ratio between low-altitude and high-altitude animals. The significant value was regarded as 1.5.