Figures & data
Figure 1. DNA barcoding based on mitochondrial 16S rRNA gene sequences (∼540 bp). (A) Maximum Likelihood RAxML tree from total 145 newly sampled and previously available populations of Microhyla mukhlesuri, M. mymensinghensis, M. nilphamariensis, and M. ornata, along with sequences representing 24 other Microhyla species. Kaloula pulchra was used as the outgroup taxon. Bayesian Posterior Probabilities and RAxML bootstrap values >50% are indicated above and below the branches, respectively. Closed circles indicate samples from the present study; open circles indicate GenBank sequences. Geographical distribution of species is shown on the right panel. (B) Frequency distribution of intra- and interspecific sequence divergences for Microhyla mukhlesuri, M. mymensinghensis, M. nilphamariensis, and M. ornata, based on uncorrected and K2P pairwise distances.
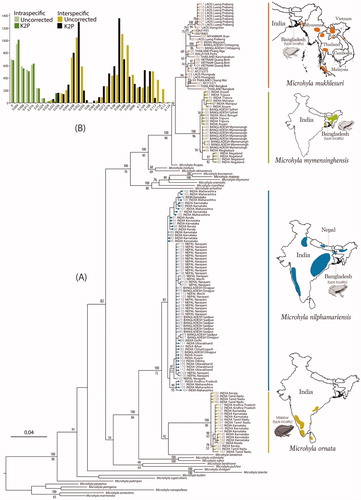
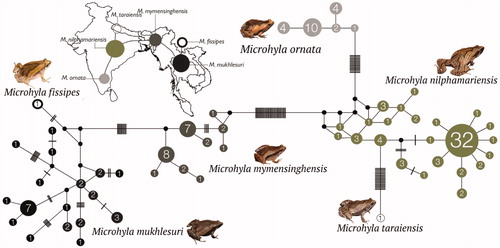
Figure 2. Median-Joining haplotype network based on 147 mitochondrial 16S rRNA gene sequences from six closely related Microhyla species. Circle sizes are proportional to the number of haplotype sequences involved, as represented with numbers inside the circles. Black circles represent median vectors. Each branch represents one mutation step; black bars represent additional mutation steps. A schematic representation of species relationships with respect to geographical distribution is shown over the map.