Figures & data
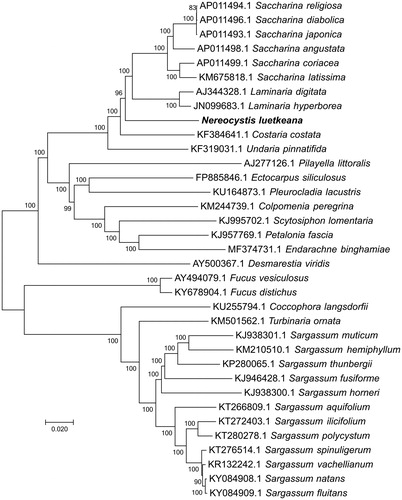
Figure 1. Evolutionary relationships of 35 brown algae. The evolutionary history was inferred using the neighbor-joining method. The percentage of replicate trees in which the associated taxa clustered together in the bootstrap test (1000 replicates) are shown next to the branches. The tree is drawn to scale, with branch lengths in the same units as those of the evolutionary distances used to infer the phylogenetic tree. The evolutionary distances were computed using the Maximum Composite Likelihood method and are in the units of the number of base substitutions per site. The rate variation among sites was modeled with a gamma distribution (shape parameter = 4).