Figures & data
Table 1. GenBank accession numbers, collection numbers, local of collection, and geospatial coordinates of specimens of the Ischnocnema, Gastrotheca, Pristimantis, and Eleutherodactylus species used in this study.
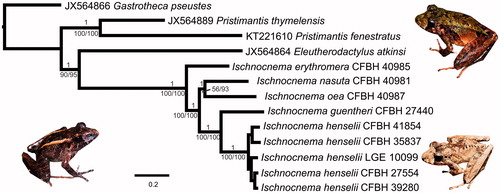
Figure 1. The 50% majority rule consensus tree from Bayesian inference analysis of mitogenomic sequences of Ischnocnema and four outgroups. Numbers above branches are posterior probabilities and numbers below branches are maximum likelihood bootstrap replicates (left) and maximum parsimony jackknife replicates (right). No support below species level is shown. Pictures show Ischnocnema nasuta (left), I. erythromera (above, right), and I. henselii (below, right).