Figures & data
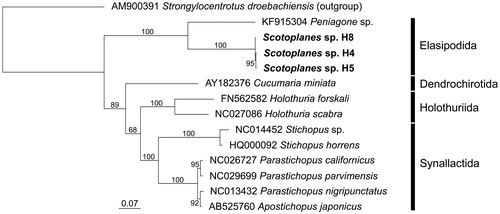
Figure 1. Maximum likelihood (ML) phylogeny of 13 holothurians based on concatenated amino acid sequences of 13 protein-coding genes (3570 positions). Scotoplanes sp. is shown in bold. Also included in the analysis was the echinoid Strongylocentrotus droebachiensis as an outgroup taxon, according to relationships among the five echinoderm classes inferred from phylogenomic analysis (Telford et al. Citation2014). Sequences were aligned separately for each gene by using MAFFT 7.397 (Katoh and Standley Citation2013) with default parameters. Ambiguously aligned positions were removed by Gblocks 0.91b (Castresana Citation2000); the ‘Allowed gap positions’ was set to ‘With half'. ML analysis was performed in RAxML 8.2.10 (Stamatakis Citation2014) using the mtREV + G model. Numbers above or below branches denote bootstrap percentages (1000 replicates). DDBJ/EMBL/Genbank accession numbers are shown for published sequences.