
Figures & data
Figure 1. (A) Dead sample of Irrawaddy dolphin, Orcaella brevirostris in Digha sea beach, West Bengal. (B) Neighbour-joining (NJ) tree of the studied freshwater and marine dolphins with bootstrap support. Three database sequences of the whale species, Balaena mysticetus used as an out-group in the phylogeny. The species under family Delphinidae and Platanistidae are clustered together and represent by color bars. The ambiguous clades of the studied species revealed in NJ phylogeny marked by red, blue and brown colors boxes. The line drawings of the dolphin species were acquired from the free media repository of Wikimedia Commons (https://commons.wikimedia.org) and are superimposed in the phylogeny.
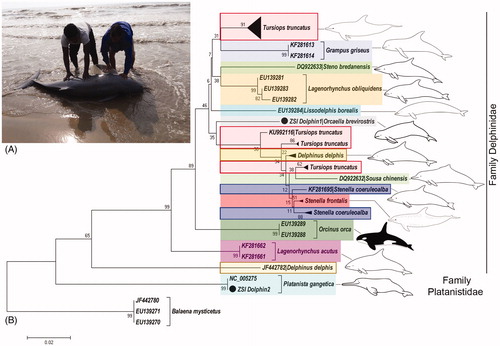
Table 1. The K2P genetic divergence of the studied freshwater and marine dolphins.