Figures & data
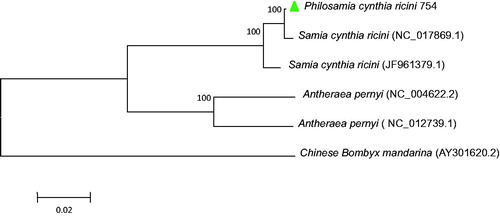
Figure 1. (A) maximum-likelihood tree illustrating the phylogenetic position of Philosamia cynthia ricini 754 among other species. The Maximum-likelihood analysis was conducted using the complete mitogenomes, and numbers at each node are bootstrap probabilities by 1000 replications shown only when they are 50% or larger. GenBank accession numbers of mitogenomic sequences for each taxon are shown.