Figures & data
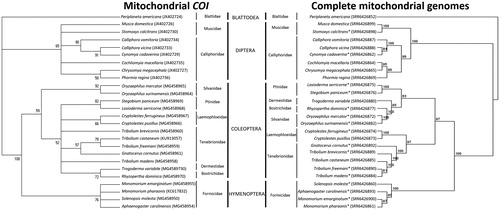
Figure 1. Maximum-likelihood (ML) trees constructed using the barcode region of the mitochondrial cytochrome oxidase I (COI) gene (left) and using complete assembled and annotated mitochondrial genomes (right) of 26 insect species belonging to 10 families and four taxonomic orders. Number above each node indicates the bootstrap support. Branches with bootstrap values <50% are collapsed. The two phylogenetic trees demonstrate the utility of complete mitochondrial genomes for high resolution phylogenetic discrimination among taxa. Insect species have their corresponding accession numbers in parenthesis.*Newly annotated insect mitochondrial genomes.