Figures & data
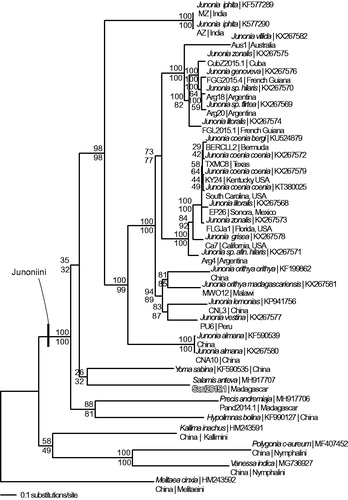
Figure 1. Maximum likelihood phylogeny (GTR + G model, Gamma =0.1930, likelihood score 75924.15364) of Salamis anteva, 25 additional mitogenomes from tribe Junonini, and 4 outgroup species from other tribes in subfamily Nymphalinae based on 1 million random addition heuristic search replicates (with tree bisection and reconnection). One million maximum parsimony heuristic search replicates produced 24 equally most parsimonious trees (parsimony score 11461 steps) one of which is identical to the topology of the maximum likelihood tree. Numbers above each node are maximum likelihood bootstrap values and numbers below each node are maximum parsimony bootstrap values (each from 1 million random fast addition search replicates).