
Figures & data
Figure 1. Median-joining network of MT-ND3 (A) and MT-ND4L (B) haplotypes. Black sector in H1 and Ha1 represents Tibetan cattle and Tibetan yak. In other haplotypes, black sector only represents Tibetan cattle. White sector represents Holstein-Friesian Cattle. The arrow indicates that the reference sequence belongs to haplotype H1 and Ha1.
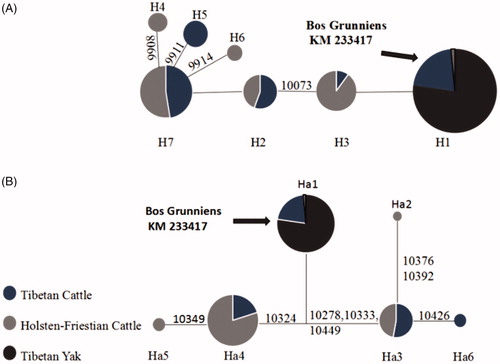
Figure 2. Diagram of the transmembrane structure of the MT-ND3 (A) and MT-ND4L (B) protein predicted using the SMART programme. The arrows indicate that the non-synonymous mutations were present in each of the transmembrane regions.
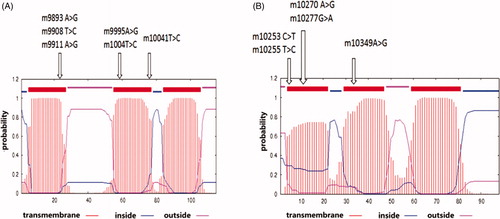
Table 1. Percentage of nucleotide composition of MT-ND3 and MT-ND4L gene sequences in Tibetan yaks (TY), Tibetan cattle (TC), and Holstein-Friesian (HF) populations.
Table 2. Mutations in MT-ND3 of Tibetan cattle (TC) and Holstein-Friesian (HF).
Table 3. Mutations in MT-ND4L of Tibetan cattle (TC) and Holstein-Friesian (HF).
Table 4. Haplotype distribution for MT- ND3 in Holstein-Friesian (HF) and Tibetan cattle (TC).
Table 5. Haplotype distribution for MT-ND4L in Holstein-Friesian (HF) cattle and Tibetan cattle (TC).