Figures & data
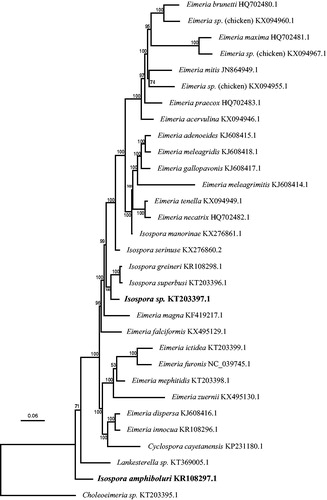
Figure 1. Phylogenetic tree based on the protein- and rRNA-coding regions of complete mitochondrial genome sequences from a variety of eimeriid coccidia rooted by a Choleoeimeria species. The unnamed Isospora sp. from the Black-throated laughingthrush was found in a weakly supported clade containing a number of Isospora species infecting passerine birds. Isospora amphiboluri branched as sister taxon to a large clade of eimeriid coccidia The Bayesian analysis was performed on an alignment of 5419 bp from each complete mitochondrial genome using extracted CDS and 33 rDNA fragments; the dataset was partitioned so that the CDS were analysed using a codon-based (mtmet translation) substitution model and the rDNA regions analysed using a GTR + G + I substitution model. Scale bar indicates hypothesized evolutionary divergence and numbers at nodes indicate Bayesian posterior probabilities.