
Figures & data
Figure 1. Phylogenetic tree constructed with MrBayes v3.2.0 (Ronquist et al. Citation2012) under the GTR + G + I model and running for 10,000,000 generations with a sampling frequency of 100 generations.
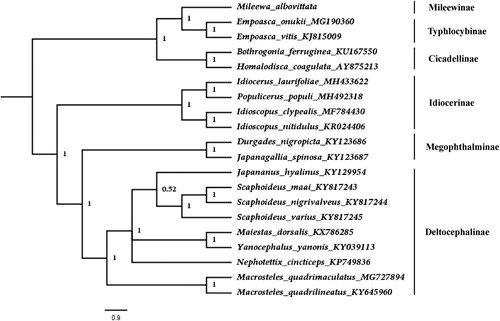
Figure 1. Phylogenetic tree constructed with MrBayes v3.2.0 (Ronquist et al. Citation2012) under the GTR + G + I model and running for 10,000,000 generations with a sampling frequency of 100 generations.