Figures & data
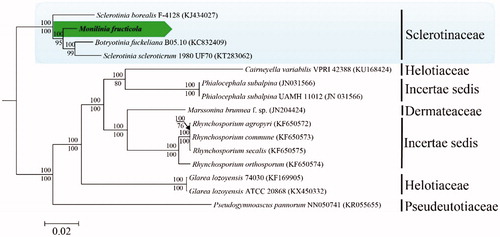
Figure 1. Phylogenetic analysis of mitochondrial genomes from Monilinia fructicola and its related species in Helotiales based on Bayesian inference and Maximum likelihood. Bayesian posterior probabilities and ML bootstrap values are shown above and below the internodes, respectively. GenBank accession numbers are shown in parentheses.