Figures & data
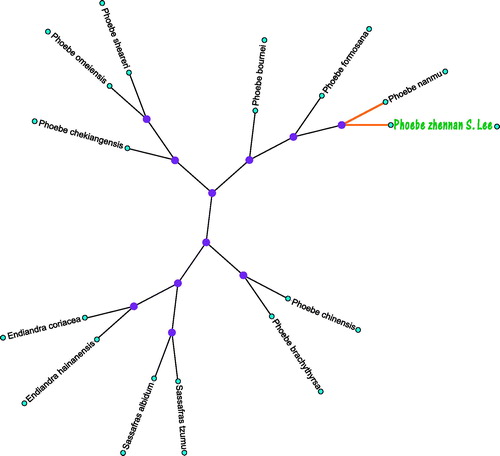
Figure 1. The maximum likelihood (ML) tree inferred from P. zhennan S. Lee and other 12 plants chloroplast genomes. This tree was drawn without setting out groups. All nodes exhibit above 90% bootstraps. The length of branch represents the divergence distance. The NCBI database accession number of P. zhennan S. Lee to P. zhennan S. Lee in the counterclockwise direction is, NC036143.1, NC272328.1, NC034926.1, NC031191.1, NC031190.1, NC034925.1, HM268714.1, HM268814.1, AF268832.1, AF272336.1, NC0372339.1, NC038324.1.