Figures & data
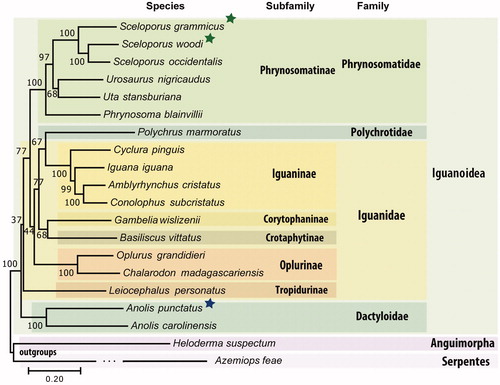
Figure 1. Phylogenomics tree inferred using maximum likelihood based on the General Time Reversible model in MEGA7. Genes from complete mitochondrial genomes from all available species from the Iguanoidea superfamily were downloaded, aligned, and concatenated into a dataset composed of 11,505 nucleotide positions. Bootstrap values (1000 replicates) are shown at the corresponding nodes. Colored boxes indicate clades described, green asterisks represent new mitochondrial genomes described here using public data while blue asterisk represent the new mitochondrial genome described here using our own data. The accession numbers of the mitogenomes used in the tree are BK010486.1, BK010487.1, NC_005960.1, NC_026308.1, NC_027261.1, NC_036492.1, NC_012839.1, NC_027089.1, NC_002793.1, NC_028031.1, NC_028030.1, NC_012831.1, NC_012829.1, NC_012827.1, NC_012836.1, NC_012834.1, MK091854.1, NC_010972.2, NC_008776.1, and NC_030781.1.