Figures & data
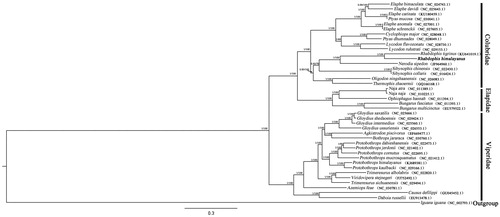
Figure 1. Bayesian tree and maximum likelihood tree estimated using 12 protein-coding genes alignment. The phylogenetic tree shown is based on the Bayesian tree topology, adding the bootstrap and posterior probability values of the nodes (BS/PP). The Genbank accession numbers for the samples are shown in the tree. Rhabdophis himalayanus appears in bold.