Figures & data
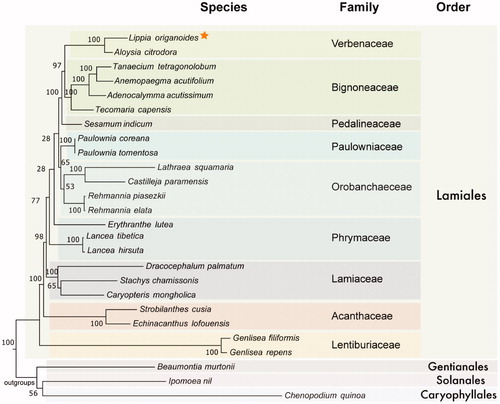
Figure 1. Evolutionary history of Lamiales inferred by Maximum Likelihood based on the General Time Reversible model using a total of 43 genes (13,959 positions) shared between 23 species of Lamiales and three outgroups. All positions containing gaps and missing data were eliminated. Bootstrap values (1000 replicates) are shown in the corresponding nodes. Orange star highlights the plastid produced here. Colored boxes were used to cluster members from different families and orders. Plastid accession numbers are: MK248831, NC_034695, NC_027955, NC_037226, NC_037455, NC_037462, NC_016433, NC_031435, NC_031436, NC_027838, NC_031805, NC_034311, NC_034312, NC_030212, NC_037693, NC_037506, NC_031874, NC_029822, NC_035729, NC_037485, NC_035876, NC_037079, NC_037081, NC_037934, NC_031159, NC_034949.