Figures & data
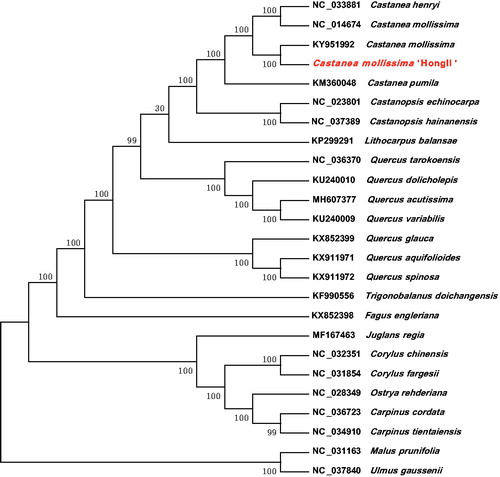
Figure 1. Phylogenetic tree inferred by maximum likelihood (ML) method based on the complete chloroplast genome of 25 representative species. Malus prunifolia and Ulmus gaussenii were used as the outgroup. A total of 1000 bootstrap replicates were computed and the bootstrap support values are shown at the branches.