Figures & data
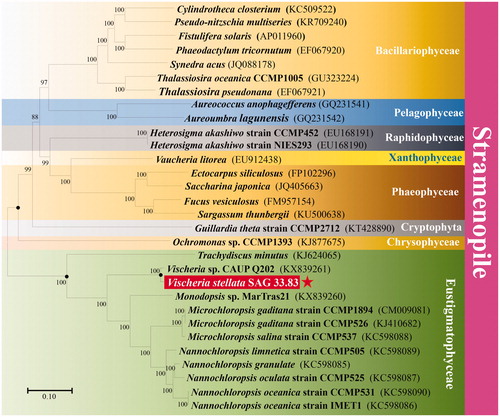
Figure 1. Phylogenetic analysis of Vischeria stellata SAG 33.83. The maximum likelihood phylogenetic tree was inferred from the 28,824 bp collinear sequences of 54 genes in all 30 algae species, by the use of General Time Reversible and Gamma distributed with invariant sites substitution model(GTR + G+I). The significant level of the phylogenetic tree was determined by bootstrap testing with 1000 replications. Bootstrap support values were then shown in branches when they reached over 88%. GenBank accession numbers are shown in parentheses and the scale bar indicates 0.10 substitutions per nucleotide position.