Figures & data
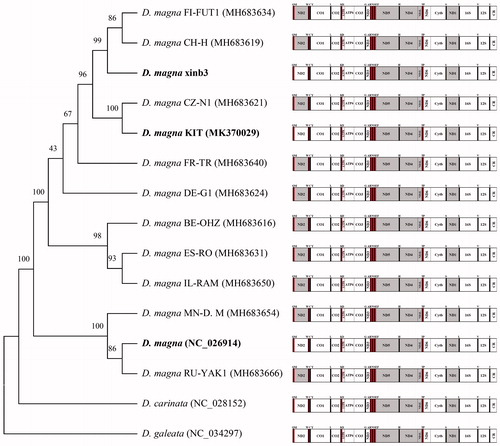
Figure 1. Phylogenetic analysis. We conducted a comparison of the mitochondrial genomes of 15 daphnids. Twelve protein-coding genes of each mitochondrial genome except for ND2 gene were aligned using MEGA software (ver. 7.0) with the ClustalW alignment algorithm. To establish the best-fit substitution model for phylogenetic analysis, the model with the lowest Bayesian Information Criterion (BIC) and Akaike Information Criterion (AIC) scores were estimated using a maximum likelihood (ML) analysis. According to the results of model test, maximum likelihood phylogenetic analyses were performed with the LG + G + I model. Gray, the opposite direction of PCGs.