Figures & data
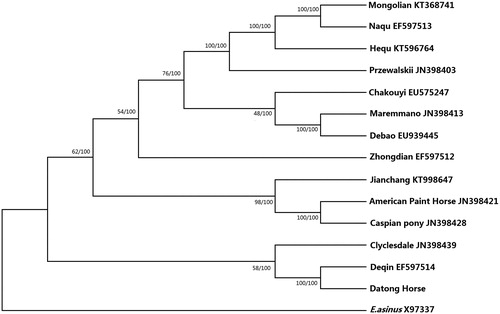
Figure 1. Phylogenetic analysis of selected Equidae species based on the maximum likelihood (ML) and neighbour-joining (NJ) methods. Concatenated coding sequences of 13 mitochondrial PCGs were assessed. The values at the nodes correspond to ML (right) and NJ (left) bootstrap support in percentages, respectively.