Figures & data
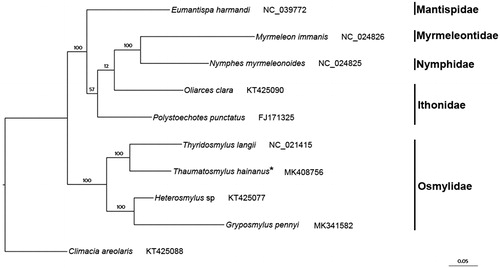
Figure 1. Phylogenetic tree inferred from ML analysis of the nucleotide of the 13 PCGs and 2 rRNA genes (13129 bp). The nodal numbers indicate the bootstrap values obtained with 1000 replicates. Genbank accession numbers for the sequences are indicated next to the species names. The newly sequenced mitogenome is indicated by the asterisk.