Figures & data
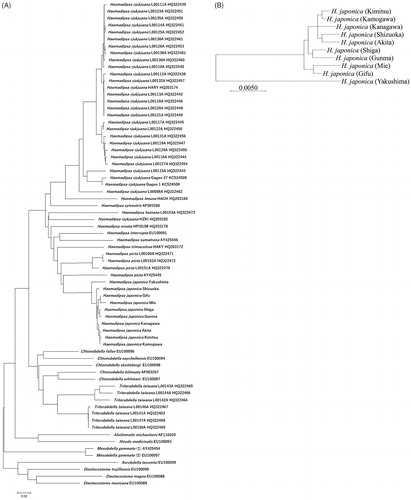
Figure 1. Maximum likelihood (ML) tree based on mitochondrial cox1 sequences. (A) ML tree based on 604 bp cox1 sequences of land leech specimens from around the world and 10 H. japonica specimens from Japan. (B) ML tree based on 1569 bp cox1 sequences of 10 H. japonica specimens from Japan. The bootstrap value based on 1000 replicates is shown on each node.