Figures & data
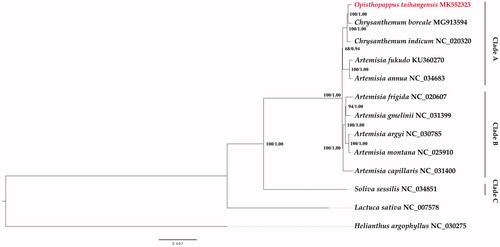
Figure 1. Phylogenetic tree of 13 species based on the complete chloroplast genome by the maximum likelihood (ML) and Bayesian inference (BI) methods. Helianthus argophyllus was the outgroup. The topology showed in this figure is from the ML tree. The numbers above the branches represent the ML bootstrap values/BI posterior probabilities.