Figures & data
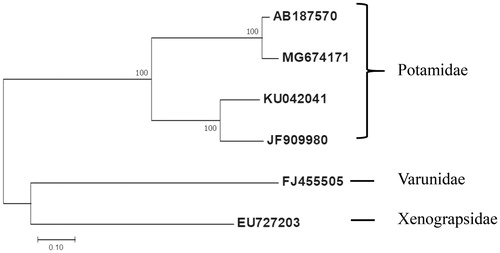
Figure 1. Molecular phylogenetic analysis by Maximum Likelihood method. The evolutionary history was inferred using the Maximum Likelihood method based on the Tamura 3-parameter model. The tree with the highest log likelihood (-13987.63) is shown. The percentage of trees in which the associated taxa clustered together is shown next to the branches. The tree is drawn to scale, with branch lengths measured in the number of substitutions per site. The analysis involved 6 nucleotide sequences. Codon positions included were first. All positions containing gaps and missing data were eliminated. Evolutionary analyses were conducted in MEGA7. Nucleotide sequence of the Geothelphusa sp. DJL-2014 isolate Gm01 (MG674171), G. dehaani (AB187570), Sinopotamon yangtsekiense (JF909980), and Sinopotamon xiushuiense (KU042041) were used. Eriocheir japonica (FJ455505) and Xenograpsus testudinatus (EU727203) were selected as outgroups.