Figures & data
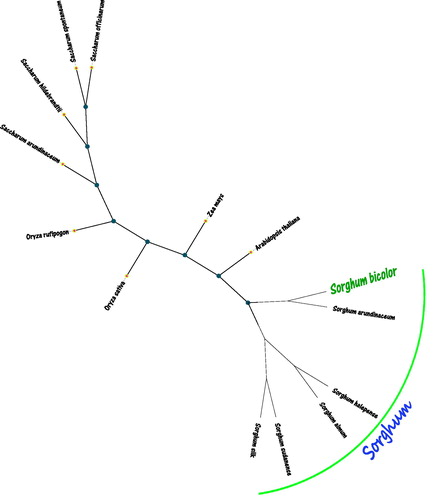
Figure 1. The maximum likelihood (ML) tree inferred from Sorghum bicolor and other 13 plants chloroplast genomes. This tree was drawn without setting out groups. All nodes exhibit above 90% bootstraps. The length of branch represents the divergence distance. The other 13 plants species and corresponding GenBank accession numbers are as follows: Sorghum arundinaceum (LS398103.1), Sorghum halepense (LS398105.1), Sorghum almum (FJ650403.1), Sorghum sudanense (KC428145.1), Sorghum silk (FJ650401.1), Saccharum officinarum (NC035224.1), Saccharum arundinaceum (LC160130.1), Saccharum spontaneum (NC034802.1), Saccharum hildebrandtii (MF563371.1), Zea mays (NC001666.2), Oryza sativa (NC031333.1), Arabidopsis thaliana (NC000932.1), and Oryza rufipogon (KF359902.1).