Figures & data
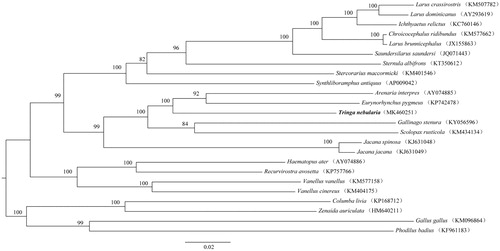
Figure 1. Phylogeny of T. nebularia and closely related 20 mitochondrial sequences constructed using the maximum likelihood (ML) method by analyzing 13 protein-coding genes (PCGs). Numbers above each branches are the ML bootstrap support. GenBank accession numbers of each species are shown in parentheses.