Figures & data
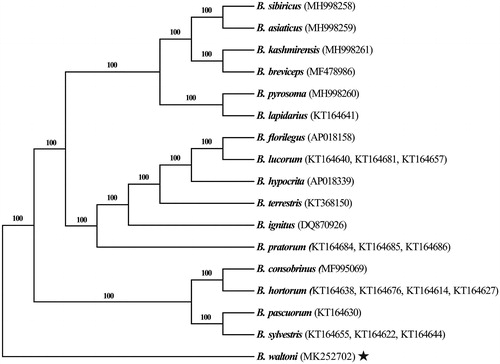
Figure 1. Phylogenetic analyses of bumblebee mitochondrial genomes with Bombus waltoni as an outgroup. The star indicates the focal mitochondrial genome in this study. Numbers beside each node represent percentages of Bayesian bootstrap values. Species names are followed by the GenBank accession numbers of their mitochondrial genomes.