Figures & data
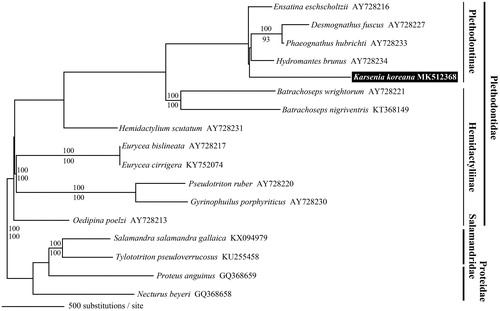
Figure 1. Maximum likelihood tree based on the complete mitochondrial genomes of Karsenia koreana and 12 other plethodontid salamanders. We used two species from each of Salamandridae and Proteidae as outgroup taxa. The accession number of each mitogenome is presented after the scientific name of the species. On each branch, the Bayesian posterior probability (above) and bootstrap value (below) are presented.