Figures & data
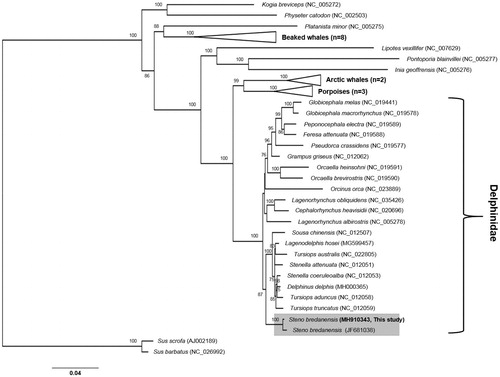
Figure 1. Maximum-likelihood phylogeny based on the 13 concatenated protein-coding genes from the available Odontoceti mitogenomes. Numbers at the branches indicate bootstrapping values obtained with 1000 replicates, and only bootstrap values >70% are indicated. The scale bar represents 0.04 nucleotide substitutions per site.