Figures & data
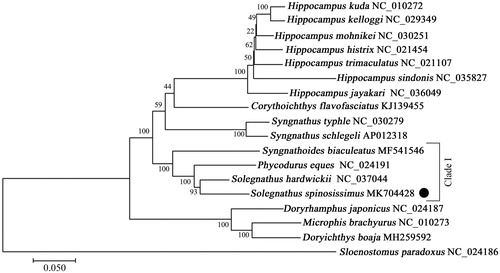
Figure 1. Phylogenetic tree showing the relationship between Solegnathus spinosissimus and 16 other Syngnathidae species based on the 13 PCGs sequences. The bootstrap value for the ML analysis based on 100 replicates was shown on each node. The Genbank accession number was listed following the species name.