Figures & data
Figure 1. A collection map of the Pseudoregma bambucicola in China.
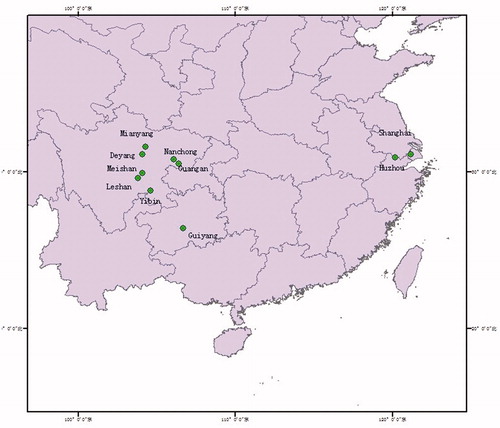
Table 1. Genetic distance of cytb genes in ten geographical populations of Pseudoregma bambusicola.
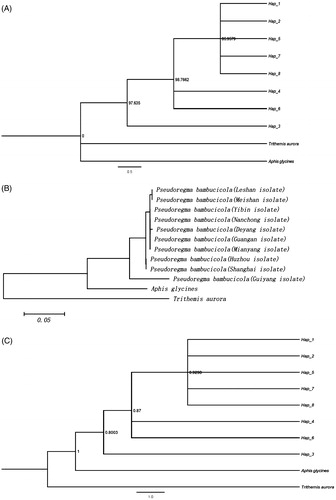
Figure 2. Phylogenetic relationships of Pseudoregma bambusicola. (A) Maximum parsimony (MP Tree). The nodal numbers is MP bootstrap values. Only values above 85% are given. (B) Neighbor joining tree (NJ Tree). (C) Bayesian inference analysis (BI Tree). The nodal numbers are posterior probability (>80%).