Figures & data
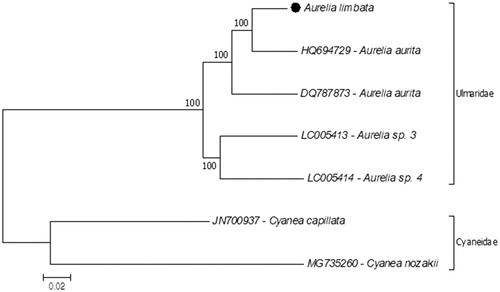
Figure 1. Molecular phylogeny of Aurelia limbata in the family Ulmaridae. Two species from the family Cyaneidae represent outgroup. The phylogeny tree reconstructed according to protein-coding genes of the mitochondrial genome with a maximum likelihood statistical method by using MEGA 7.0 software. mtREV with JTT matrix-based model used for amino acid substitution and bootstrap method replicated 1000 times for the test of phylogeny. The complete mitochondrial genomes were retrieved from the GenBank. Aurelia limbata highlighted with a black dot.