Figures & data
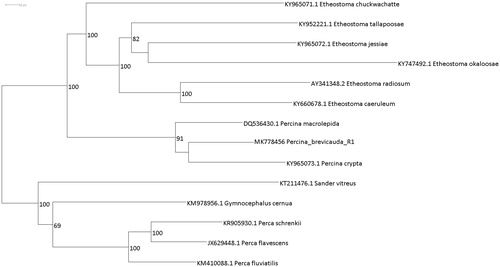
Figure 1. Interspecific phylogeny inferred under the maximum-likelihood optimality criteon (Stamatakis Citation2014). Support values are represented by bootstrap replicates in which the taxa clustered together by using the automatic halting bootstrap method (Pattengale et al. Citation2009).