Figures & data
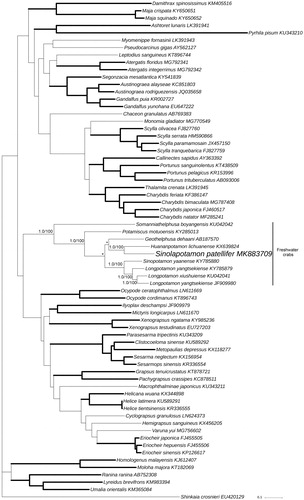
Figure 1. Bayesian Inference (BI) phylogenetic tree of Sinolapotamon patellifer and other related brachyurans based on 13 PCGs in mitogenomes. Shinkaia crosnieri is served as an outgroup. Numbers on internodes are BI bootstrap proportions and the ML posterior proportions. The same of phylogenetic trees between ML and BI are indicated by bold branches. The differences of freshwater crabs between the ML and BI trees are indicated by ‘*’. The scale bars represent genetic distance.