Figures & data
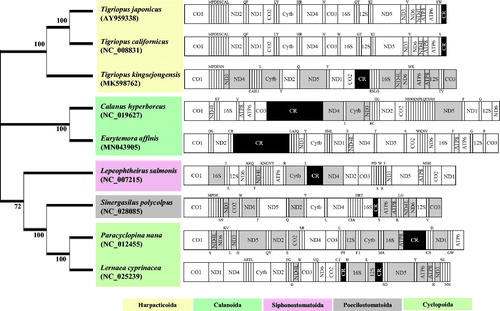
Figure 1. Phylogenetic analysis. We conducted comparison of the mitochondrial genomes of nine copepods. Amino acids of 13 PCGs gene from nine copepods were aligned using MEGA software (ver. 10.0.1) with the ClustalW alignment algorithm. To establish the best-fit substitution model for phylogenetic analysis, the model with the lowest Bayesian Information Criterion (BIC) and Akaike Information Criterion (AIC) scores were estimated using a maximum-likelihood (ML) analysis. According to the results of model test, maximum likelihood phylogenetic analyses were performed with the LG + G + I model. Gray color represents the opposite direction of PCGs and the Black color represents the control regions; Upper and lower single letters indicate the direction of tRNA clockwise and anticlockwise, respectively. Modified from Hwang et al. (Citation2019).