Figures & data
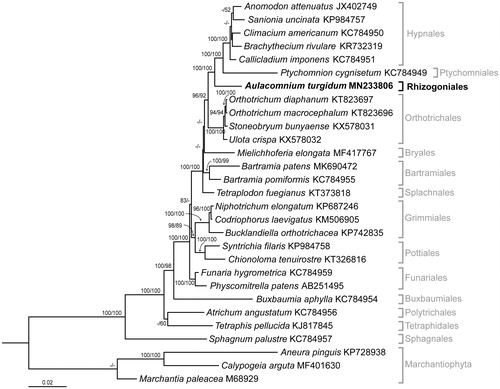
Figure 1. Maximum-likelihood (ML) tree inferred from the amino acid sequences of 32 mitochondrial genes with JTT + G + F parameters in MEGA7. ML and NJ trees were constructed using 1000 bootstrap replicates. Bootstrap values above 80 and 50 are shown on the branches of the ML and NJ trees, respectively.