Figures & data
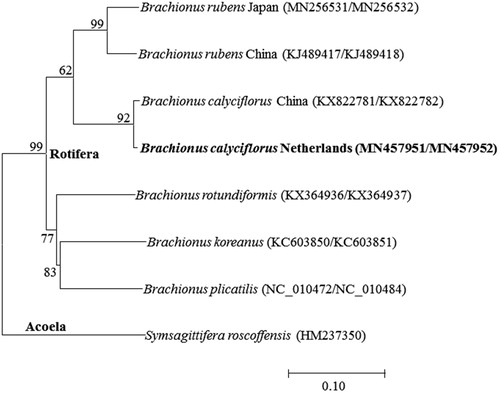
Figure 1. Phlyogenetic analysis of mitochondrial DNA. We conducted a comparison of the 13 mitochondiral DNA genes of Acoela and Rotifera. The 13 mitochondrial DNA genes were aligned by ClustalW. Maximum-likelihood analysis was performed by Mega software (ver. 10.0.1) with LG + G + I model. The rapid bootstrap analysis was conducted with 1000 replications with 48 threads running in parallel. The Acoela served as outgroup. -Ln = 24394.24.