Figures & data
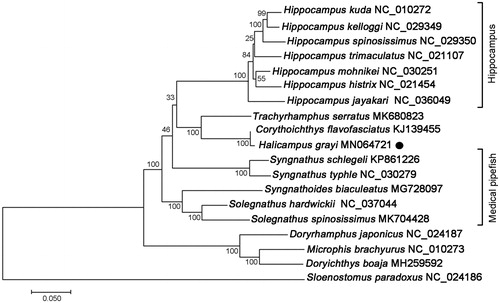
Figure 1. ML phylogenetic tree of Halicampus grayi and other representative Syngnathidae species based on the complete mitochondrial protein coding sequences. Numbers above the lines indicate the bootstrap value for the ML analysis based on 100 replicates. The GenBank accession numbers were listed following the species name.