Figures & data
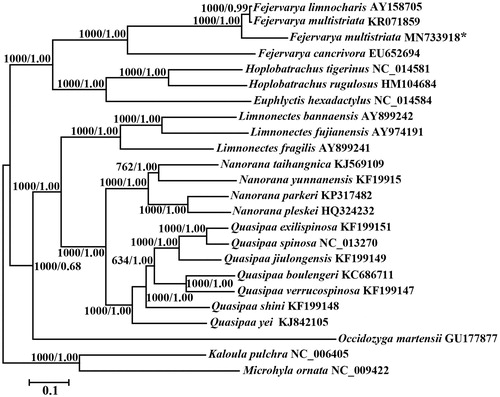
Figure 1. Phylogenetic tree of the relationships among 22 dicroglossids frogs and two species of Microhylidae as outgroups (Microhyla pulchra and Kaloula pulchra) based on the nucleotide dataset of the 13 mitochondrial protein-coding genes. Branch lengths and topology are from the BI analysis. Numbers above branches specify posterior probabilities from Bayesian inference (BI) and bootstrap percentages from maximum likelihood (ML, 1000 replications) analyses. Tree topologies produced by Bayesian inferences (BI) and maximum likelihood (ML) analyses were equivalent. bootstrap support values for ML analyses and Bayesian posterior probability are shown orderly on the nodes. The asterisks indicate new sequences generated in this study.