
Figures & data
Figure 1. Map showing sampling location of the wild gaur from the Melghat Tiger Reserve of Central India.
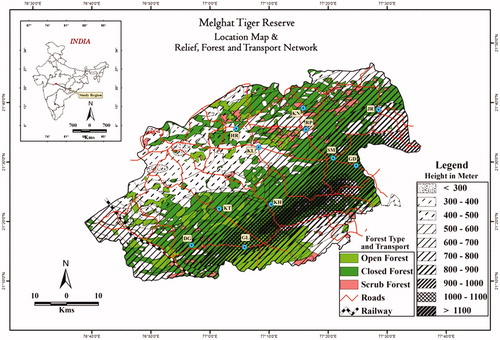
Table 1. D–loop and Cyt b dataset submitted to GenBank.
Figure 2. Mitochondrial D-loop sequence variation comparison in extant and historical wild gaur DNA samples.
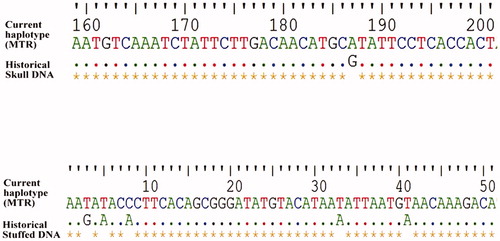
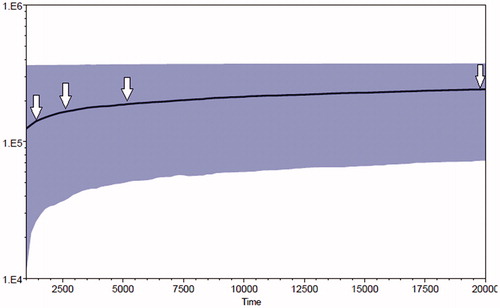
Figure 3. The Bayesian Skyline Plot (BSP) showing past and present population dynamics of wild gaur. Numbers on the X-axis show time in thousand years and those on the Y-axis show effective population size (Ne). Note the distinct decline in effective population size around 5 kya onwards.
Supplemental material