Figures & data
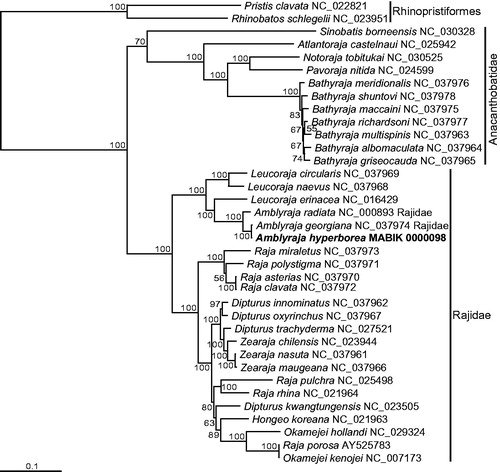
Figure 1. Mitogenome-based maximum likelihood (ML) phylogram of Amblyraja hyperborea (in bold), plus related species. The bars on the right represent the outgroup order (Rhinopristiformes) and the two families (Anacanthobatidae and Rajidae) within the order Rajiformes. The nucleotide sequence matrix included the codons of the 12 protein-coding, rRNA, and tRNA genes. A bootstrap value above 50% in the ML analysis is indicated at each node.