Figures & data
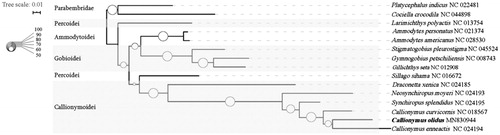
Figure 1. Phylogenetic tree using the COI sequences. The sequences are downloaded from GenBank and the phylogenic tree is constructed by maximum-likelihood (ML) method. The bootstrap values and posteriori probability were presented as the proportion of white circles, respectively. The genomic sequences obtained in this study are shown by bold type.