Figures & data
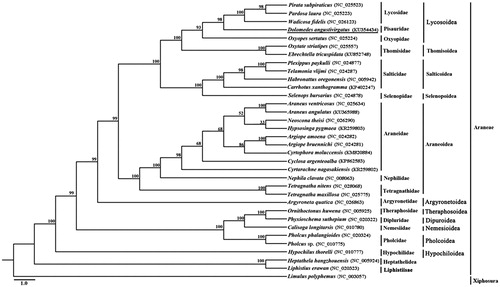
Figure 1. Phylogenetic reconstruction of 33 spider species based on nucleotide sequences of mitochondrial 13 protein-coding genes using Maximum likelihood (ML). Numbers at the branch indicate the percentages from ML bootstrapping. GenBank accession number of a given mitochondrial genome is parenthesized following the name of each spider species. Spider determined in this study is underlined.