Figures & data
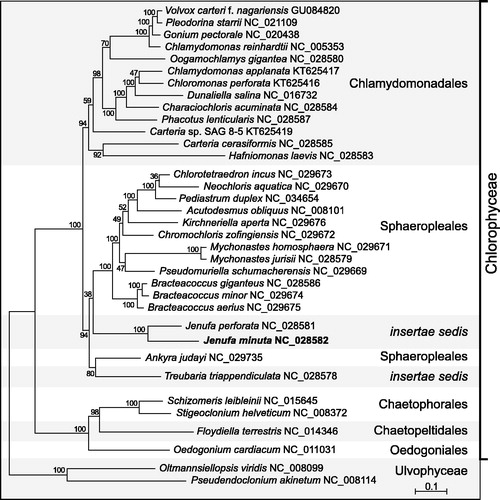
Figure 1. RAxML tree inferred from 55 concatenated plastome-encoded proteins of 33 chlorophycean green algae. Oltmannsiellopsis viridis and Pseudendoclonium akinetum (Ulvophyceae) were used as outgroup taxa. The figure shows the best-scoring tree, with bootstrap support values (100 replicates) reported on the nodes. GenBank accession numbers are provided for the plastomes of all taxa. The scale bar denotes the estimated number of amino acid substitutions per site. The data set was generated using the predicted protein sequences derived from atpA, atpB, atpE, atpF, atpH, atpI, ccsA, cemA, clpP, petB, petD, petG, petL, psaA, psaB, psaC, psaJ, psbA, psbB, psbC, psbD, psbE, psbF, psbH, psbI, psbJ, psbK, psbL, psbM, psbN, psbT, psbZ, rbcL, rpl2, rpl5, rpl14, rpl16, rpl20, rpl23, rpl36, rpoA, rpoB, rpoC2, rps3, rps4, rps7, rps8, rps9, rps11, rps12, rps14, rps18, rps19, tufA, ycf3. Following alignment of the sequences of individual proteins with Muscle v3.7 (Edgar Citation2004), ambiguously aligned regions were removed using TrimAL v1.4 (Capella-Gutierrez et al. Citation2009) with the options block = 6, gt = 0.7, st = 0.005 and sw = 3, and the protein alignments were concatenated using Phyutility v2.2.6 (Smith and Dunn Citation2008). The phylogenetic analysis was carried out under the GTR + Γ4 model.