
Figures & data
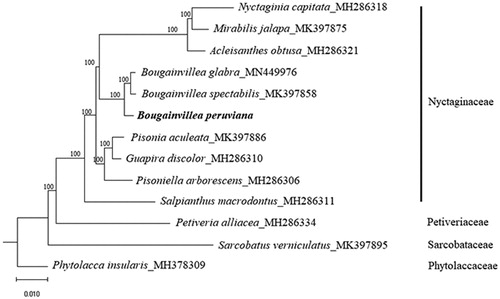
Figure 1. Maximum-likelihood tree based on the chloroplast genome sequences of 10 species from the family Nyctaginaceae, with Petiveria alliacea (Petiveriaceae), Sarcobatus vermiculatus (Sarcobataceae), and Phytolacca insularis (Phytolaccaceae) as outgroup. Shown next to the nodes are bootstrap support values based on 1000 replicates.
Data availability statement
The data that support the findings of this study are openly available in the NCBI GenBank at http://www.ncbi.nlm.nih.gov, accession number MT407463.