
Figures & data
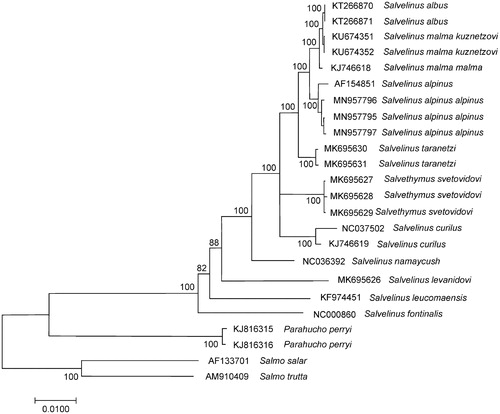
Figure 1. Maximum likelihood (ML) tree constructed on the comparison of complete mitochondrial genome sequences of Salvelinus alpinus alpinus and other GenBank representatives of the family Salmonidae. The tree is based on the GTR plus gamma plus invariant sites (GTR + G+I) model of nucleotide substitution. Genbank accession numbers for all sequences are listed in the figure. Numbers at the nodes indicate bootstrap probabilities from 1000 replications (values below 80% are omitted). Phylogenetic analysis was conducted in MEGA X (Kumar et al. Citation2018).
Data availability statement
The data that support the findings of this study are openly available in the National Center for Biotechnology Information database (NCBI/GenBank) at https://https.ncbi.nlm.nih.gov/, reference numbers MN957795, MN957796, and MN957797.