
Figures & data
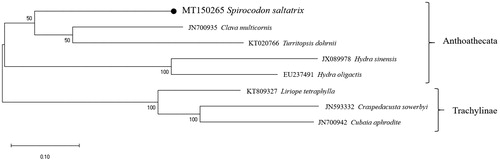
Figure 1. Molecular phylogeny of hydrozoans. The tree was reconstructed using concatenated amino acid sequences of 13 mitochondrial protein-coding genes and the maximum-likelihood (ML) algorithm with the JTT matrix-based model in MEGA X software. Bootstrap proportions (BP) of the 1000 times replications were incorporated into the ML tree. The branch lengths are proportional to the scale given. Spirocodon saltatrix determined here represents with a black dot.
Data availability statement
The data that support the findings of this study are openly available in GenBank with the accession number MT150265 (https://www.ncbi.nlm.nih.gov/nuccore/ MT150265).