
Figures & data
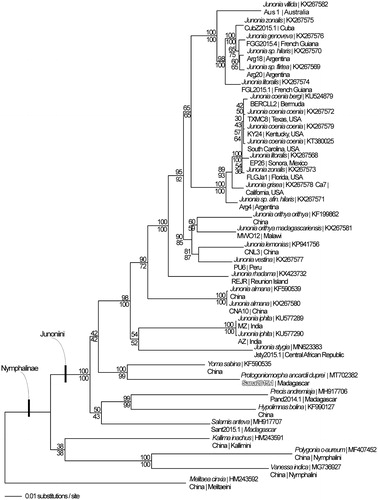
Figure 1. Maximum likelihood phylogeny (GTR + G model, likelihood score (84716.13)) of Protogoniomorpha ancardii duprei, 28 additional mitogenomes from tribe Junoniini, and 4 outgroup species from other tribes in subfamily Nymphalinae based on 1 million random addition heuristic search replicates (with tree bisection and reconnection). One million maximum parsimony heuristic search replicates produced 8 trees (parsimony score 13,373 steps) which differ from one another only by the arrangement of Junonia coenia mitogenomes and one of which has an identical tree topology to the maximum likelihood tree depicted here. Numbers above each node are maximum likelihood bootstrap values and numbers below each node are maximum parsimony bootstrap values (each from 1 million random fast addition search replicates).
Data availability statement
The data that support the findings of this study are openly available in GenBank of NCBI at https://www.ncbi.nlm.nih.gov, reference numbers MT702382 and MT702383.